
26 Australian Business Statistics You Should Know for 2025


Discover essential Australian business statistics that you should know to stay informed with the latest data and trends to help your business thrive.

- In this article
- General Statistics
- Industry-by-Industry Business Statistics for 2021-22
- Industry-by-Industry Business Statistics – 2022-23 Update
- Emerging Sectors in Australia
- Personal Services: Hairdressing and Beauty Services in Australia
- Food and Beverage: Meal Kit Delivery Services in Australia
- Women in Business
- The Australian Tech Sector
- Conclusion
In Australia, kangaroos might outnumber people, but the business stats are anything but sparse.
Australia isn't just famous for its stunning beaches and unique wildlife - it's also a vibrant hub of economic activity.
So, let's jump into 26 Australia's business statistics that will uncover everything you need to know, from the most popular business structures to emerging trends!
General Statistics
1. Dominance of Small Businesses:
97.3% of all Australian businesses are classified as small businesses, defined as those with fewer than 20 employees. This translates to 2,520,419 small businesses out of a total of 2,589,873 businesses in June 2023.
2. Number of People Employed:
In June 2019, Australian businesses employed about 11.9 million people.
Despite global economic challenges, they can still employ many people, proving their resilience and ability to adapt.
3. Employment Distribution:
The majority of these small businesses are self-employed or non-employing (61%). Additionally, 27% of businesses employ 1-4 people, and 9% employ 5-19 people. Only 2.5% are medium-sized (20-199 employees), and a mere 0.2% are large businesses (200+ employees).
3. Turnover Insights:
When examining turnover, 98% of Australian businesses have an annual turnover of $10 million or less. The breakdown is as follows:
- 24.67% have a turnover of $0 to less than $50k.
- 32.66% have a turnover of $50k to less than $200k.
- 34.59% have a turnover of $200k to less than $2 million.
- The remaining businesses have turnovers ranging from $2 million to more than $10 million.
4. Economic Contributions:
Small businesses are a crucial component of the Australian economy, contributing significantly to employment and economic output. Their resilience and adaptability have been pivotal in navigating economic fluctuations.
5. Trends and Growth:
The overall number of businesses increased in the 2022-23 financial year across all sizes, except for small businesses with 1-4 employees, which saw a decrease of 3.3%.
Industry-by-Industry Business Statistics for 2021-22
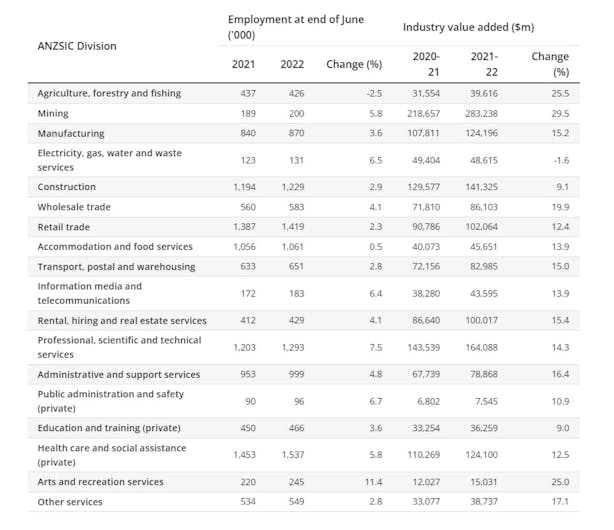
According to the Australian Bureau of Statistics, here are some key numbers from the 2021-22 financial year. The next update will be released by the end of this month, and if you’re looking for something in particular, check out the website.
6. Key Industry Highlights:
- Mining: Earnings increased by $54.3 billion (32.7%), with employment rising by 5.8% to 200,000.
- Rental, Hiring, and Real Estate Services: Earnings rose by $8.5 billion (13.5%), with employment up by 4.1% to 429,000.
- Wholesale Trade: Earnings grew by $8.0 billion (30.2%), with employment increasing by 4.1% to 583,000.
- Manufacturing: Earnings increased by $7.6 billion (17.8%), with employment rising by 3.6% to 870,000.
- Construction: Earnings declined by $5.4 billion (-9.3%), though employment rose by 2.9% to 1.23 million.
7. Employment Trends
- Total Employment: Increased by 462,000 people (3.9%) across all industries.
- Top Growth Sectors:
- Professional, Scientific, and Technical Services: +90,000 people (7.5%)
- Health Care and Social Assistance: +84,000 people (5.8%)
8. Business Performance by Size
- Medium-Sized Businesses: Strong growth in employment (+161,000 people, 5.7%), sales and service income (+13.8%), and EBITDA (+30.7%).
- Large Businesses: Notable increases in employment (+180,000 people, 4.5%), sales and service income (+13.7%), and OPBT (+58.6%).
9. State and Territory Highlights
- New South Wales: Largest share of total sales and service income at 31.2%.
- Queensland: Significant growth driven by the mining and wholesale trade industries.
Industry-by-Industry Business Statistics – 2022-23 Update
10. Overview of Business Changes
In the financial year 2022-23, the Australian business landscape saw notable shifts across various industries:
Construction Industry:
- Status: Remains the largest industry by number of businesses.
- Change: Contracted by 0.1% (-392 businesses)
Growth Sectors:
- Health Care and Social Assistance: Increased by 6.1%.
- Financial and Insurance Services: Rose by 2.7%.
- Transport, Postal, and Warehousing: Grew by 2.4%
Declining Sectors:
- Administrative and Support Services: Declined by 1.6%.
- Retail Trade: Dropped by 1.4%
11. Employment by Industry
The largest industries by number of employees continue to be:
- Healthcare and Social Assistance
- Retail Trade
These two sectors collectively account for nearly 24% of Australia's workforce, demonstrating their dominance in employment.
12. Business Survival Rates
The survival rate of new businesses varies significantly by industry:
- Agriculture, Forestry, and Fishing: Just under 64% of businesses survived beyond three years.
- Transport, Postal, and Warehousing: Only 35.6% survived beyond three years.
- Overall Survival Rate: Across all industries, the survival rate was 50.8%.
13. Economic Insights
According to experts, the recovery from the pandemic and international factors have been crucial in determining industry performance in 2023:
- Positive Outlook: Tourism and education sectors are expected to continue recovering strongly, benefiting related hospitality and services industries.
- Challenges: Building and construction sectors face pressures due to increased interest rates impacting house prices and development.
14. State-by-State Business Statistics
- Australian Capital Territory (ACT): Had the highest growth rate at 3.5%.
- New South Wales (NSW): Continues to have the highest number of businesses, with 870,916 businesses.
- Victoria: The only state to record a decline, with 7,607 fewer businesses operating (-1%).
- Business Migration: Queensland had the highest inward business migration (+1,782), while Victoria had the highest outward migration (-1,345)
Emerging Sectors in Australia
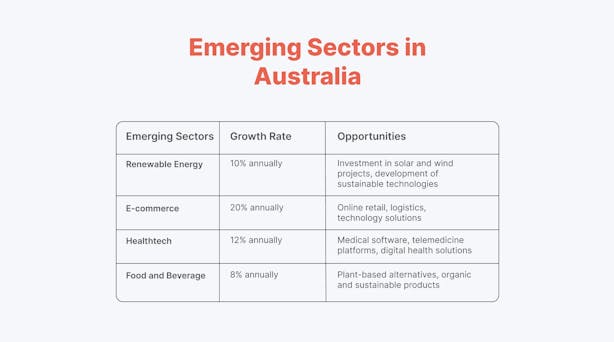
Keeping track of market trends in Australia allows businesses to strategically position themselves to meet consumers' evolving needs and preferences. Below is an overview of some of the top emerging sectors, their growth rates, and potential opportunities for businesses:
Emerging Sectors Overview
15. Detailed Insights
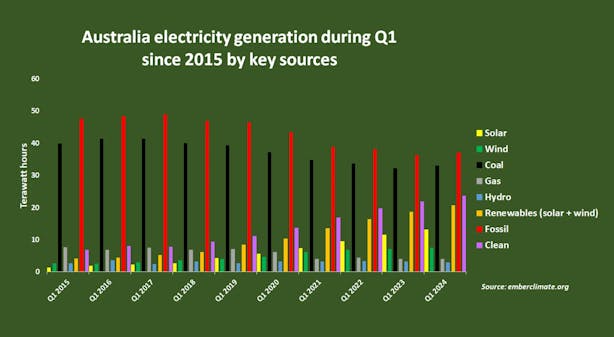
1. Renewable Energy: The renewable energy sector is experiencing significant growth due to increasing investments in solar and wind projects.
The development of sustainable technologies is also driving this sector forward, presenting numerous opportunities for innovation and investment.
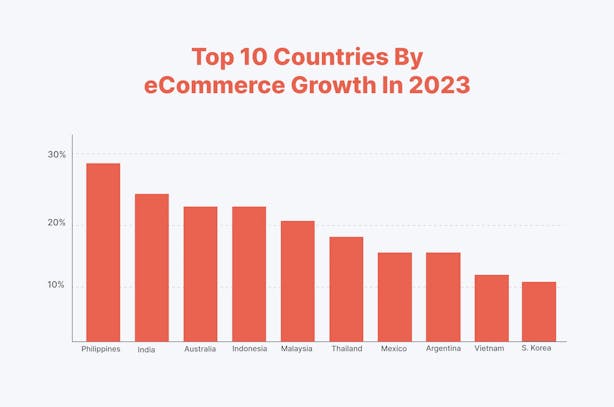
2. E-commerce: With a 20% annual growth rate, the e-commerce sector continues to expand rapidly. This growth is fueled by the increasing shift towards online shopping, creating opportunities in online retail, logistics, and technology solutions to enhance the e-commerce experience.
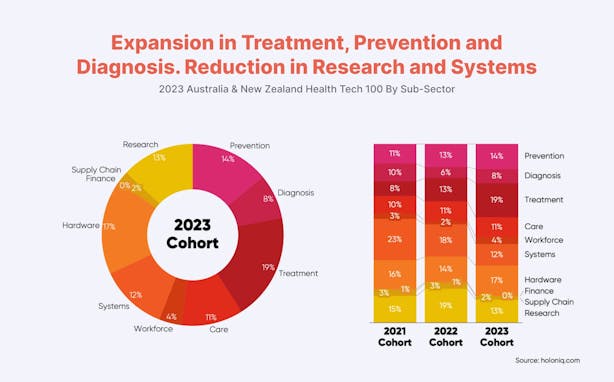
3. Healthtech: Health technology is growing at an annual rate of 12%, driven by advancements in medical software, telemedicine platforms, and digital health solutions.
This sector offers significant opportunities for businesses developing innovative health technologies to meet the rising demand for digital health services.
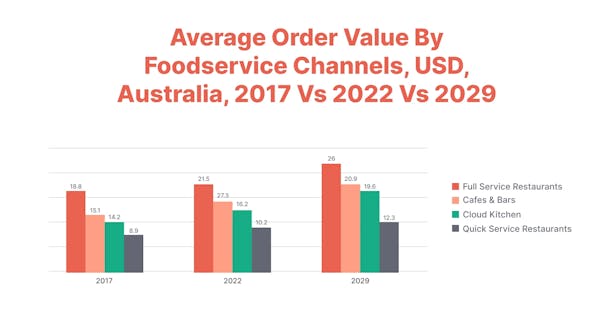
4. Food and Beverage: This sector, growing at 8% annually, is seeing increased demand for plant-based alternatives and organic products.
Businesses can capitalize on the trend towards healthier and more sustainable food options, which aligns with consumer preferences for environmentally friendly and health-conscious products.
Personal Services: Hairdressing and Beauty Services in Australia
The Australian Hairdressing and Beauty Services industry is valued at $7.5 billion in revenue. It employs 108,000 people across 26,014 businesses, and total wages amount to $4.4 billion.
16. Recent Performance and Trends
Over the past five years, the industry has faced a challenging environment, with revenue declining at a compound annual growth rate (CAGR) of 5.5%.
Despite this, the number of employees grew by 2.0% annually, indicating the labor-intensive nature of the industry.
The number of businesses also increased slightly by 0.9% annually due to the low barriers to entry.
Wages in the industry have grown by 3.4% annually, reflecting the increasing cost of skilled labor. Profit margins have seen a modest rise, indicating some recovery post-pandemic.
Key Industry Insights
- Rising Image Consciousness: A growing consumer focus on personal appearance continues to drive demand for hairdressing and beauty services.
- Economic Pressures: Despite economic uncertainties, essential services like haircutting and styling remain central to the industry. These services have rebounded strongly since the pandemic.
- Geographic Benefits: Hairdressing and beauty salons in densely populated states such as Queensland, New South Wales, and Victoria benefit from a steady business flow, ensuring consistent income.
- Competitive Strategies: Salons that offer unique, premium services are able to maintain higher pricing and profitability. Boosting visibility through deal platforms and fostering customer loyalty are crucial strategies for sustained success.
17. Major Players
The largest companies in the industry include LCA Franchising Pty Limited, which had revenue of $149.2 million in 2024, Hairhouse Warehouse, and Just Cuts, each with revenue of $74.6 million. These companies represent a small portion of a highly fragmented market, predominantly composed of numerous small, independent salons.
Food and Beverage: Meal Kit Delivery Services in Australia
The Meal Kit Delivery Services industry employs approximately 1,979 people across 24 businesses, total wages amounting to $112.9 million.
18. Recent Performance and Trends
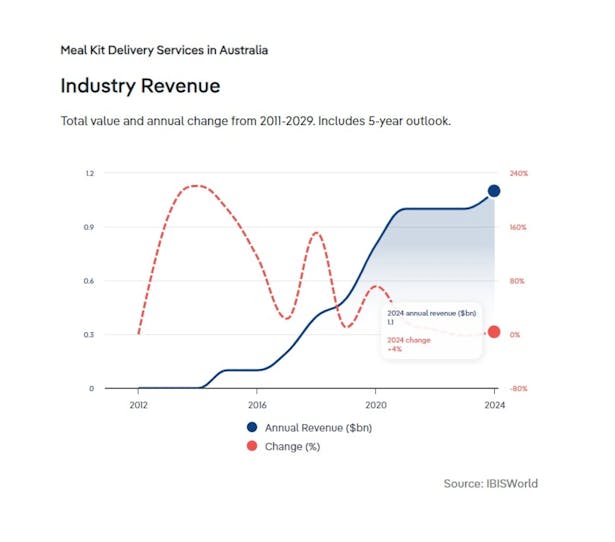
The Meal Kit Delivery Services industry has experienced significant growth over the past five years, with a compound annual growth rate (CAGR) of 17.2%.
This surge is attributed to increased health consciousness among consumers, rising disposable incomes, and the growing adoption of online shopping.
The COVID-19 pandemic accelerated this trend as consumers turned to meal kits to avoid grocery stores and maintain social distancing.
However, profitability remains a challenge for meal kit providers. High marketing costs and logistical demands to ensure food safety and attract new customers have increased operating expenses.
Despite these challenges, the industry's revenue has seen robust growth, reaching $1.1 billion in 2024.
Key Industry Insights
- Consumer Preferences: Two-serving meal plans are particularly popular among individuals and smaller households, while four-serving plans have declined due to the decreasing size of households.
- High Initial Costs: New entrants face high initial expenses and pricing challenges. Effective advertising is crucial for generating awareness and competing with established brands.

Women in Business
Women in business in Australia have made significant strides in recent years, but challenges remain. As of 2020, women comprised 35% of all self-employed entrepreneurs in Australia, reflecting their growing presence and influence in the business sector.
19. Industry Participation:
- Healthcare and Social Assistance: Women dominate the healthcare and social assistance sector, representing about 77.7% of the workforce. This sector includes hospitals, medical and dental services, and social assistance services.
- Education and Training: This is another sector with high female participation, with women making up approximately 71.9% of the workforce. This sector includes primary, secondary, and higher education, as well as adult and community education.
- Retail Trade: In the retail trade sector, women constitute about 56.6% of the workforce and are involved in various retail activities, from department stores to online retailing.
20. Leadership and Representation:
- Board and Executive Positions: Women hold 34.5% of board positions in the ASX 200 companies as of 2023, showing an increase from previous years. However, they only make up 19.9% of CEO positions in these companies, indicating room for improvement in top executive roles.
- Entrepreneurship: The number of female entrepreneurs is increasing, with women starting businesses at a faster rate than men. This growth is driven by the desire for flexibility, independence, and the opportunity to balance work and family commitments.
21. Gender Pay Gap:
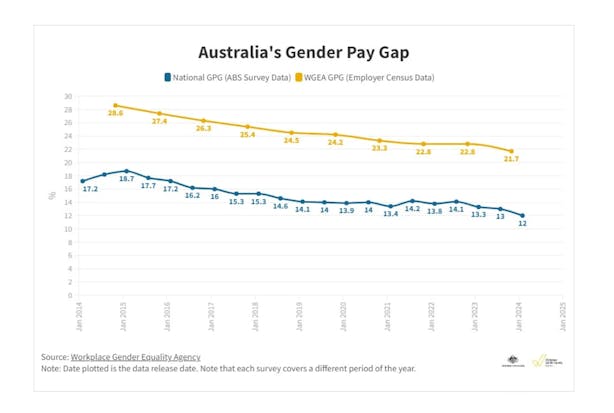
The gender pay gap in Australia remains a significant issue, with women earning on average 21.7% less than men across all industries. This gap includes base salary, bonuses, and additional payments.
22. Support and Initiatives:
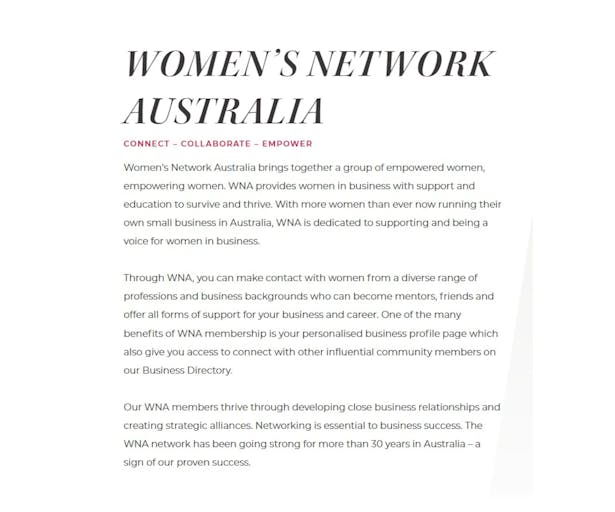
Various initiatives and support systems are in place to encourage women in business, including government grants, mentorship programs, and networking opportunities. Organizations like the Workplace Gender Equality Agency (WGEA) and Women’s Network provide resources and support to female entrepreneurs and professionals.
The Australian Tech Sector
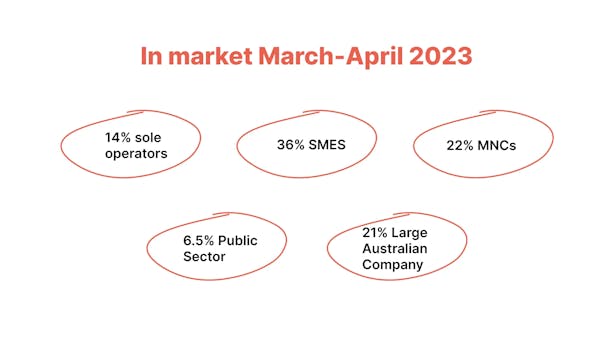
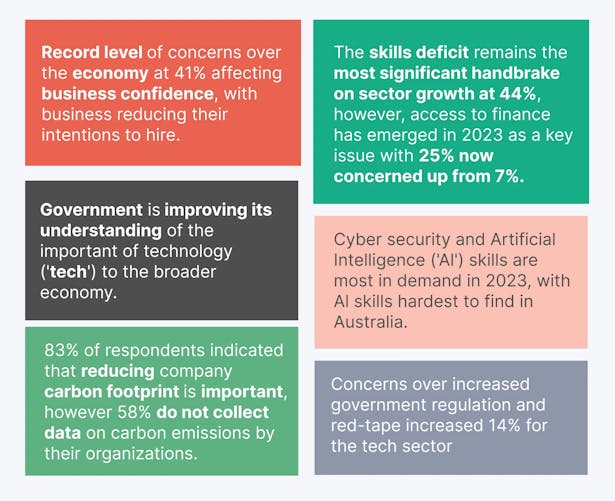
Based on the "Digital State of the Nation 2023" report from the Australian Information Industry Association – AIIA, here are insights about the Australian tech sector provided by their members, as follows:
23. Skills and Workforce:
- Skills Deficit: Skills shortages (44%) are the top barrier to growth, followed by limited access to finance (25%).
- In-Demand Skills: Cybersecurity (52%), AI (50%), and cloud-specific skills (36%) are the most sought-after skills.
- Workforce Reskilling: 67% of businesses are actively reskilling their workforce, with another 19% planning to do so.
24. Government and Policy:
- Government Engagement: 45% believe federal and state governments understand the importance of Information and Communication Technology – ICT, an increase from previous years.
- Policy Priorities: Key areas include AI policies (42%), cybersecurity (59%), and reducing regulatory burdens (55%).
25. Industry Sectors and Technology Adoption:
- Growth Sectors: Government and infrastructure (72%), media and telecommunications, and professional services are expected to see the greatest ICT adoption.
- Driving Factors: Managing risk and compliance (57%) and enhancing customer experience are primary drivers of technology adoption.
26. Technology Trends:
- AI Usage: 36% currently use AI, with 12% planning to introduce it in the next 12 months.
- Cloud Adoption: Cloud-based products/services are anticipated to be the primary acquisition from the market (72%).
Conclusion
These Australian business statistics can help you understand and navigate market trends, optimize operations, and foster inclusivity, ensuring sustained growth and competitiveness.
And, to ease this burden even more – why not try ANNA – the all-in-one solution for all your business needs?

ANNA is the ultimate business companion, simplifying every step of your entrepreneurial journey:
⭐ Start-Up Support: We handle everything from company registration to banking setup, ensuring a hassle-free start.
⭐ Effortless Finances: Say goodbye to paperwork chaos! Anna keeps your books organized and taxes in check, automatically.
⭐ Tax Relief: No more tax headaches! Anna predicts your bills, reminds you of deadlines, and offers expert assistance.
⭐ Smart Spending: Save big on taxes with Anna's expense sorting and Bookkeeping Score boost.
⭐ Total Financial View: Track all your finances in one place, seamlessly integrating with other accounts.
⭐ Speedy Invoicing: Send polished invoices quickly and get paid faster with automated follow-ups.
⭐ Friendly Reminders: Anna keeps you on track with gentle nudges for important tax dates.
With Anna by your side, running your business has never been smoother or more satisfying!


